In the post-implementation phase of projects implementing the deployment of standard OEE metrics, new requirements for customizing the metrics to meet the specific needs of the enterprise will typically emerge. The required modifications are at the level of data collection, calculation of indicators, analysis of results or management of downstream processes. We will now look at modifications to OEE metrics that can be used to evaluate and reward staff.
DERIVED INDICATORS OEE
In the article “OEE and the derived indicators TEEP, PEE, OAE, OPE, OFE, OTE and CTE” we discussed the derived indicators of OEE. We will follow up on some of the indicators with personnel valuation issues, so we will briefly review them in the introduction
PEE – the main difference in PEE (Production Equipment Efficiency) lies in the weights of the sub-indicators (Availability, Performance and Quality). While in OEE all sub-indicators have the same importance, in PEE the importance of a sub-indicator is determined by a set weight. The method of calculating PEE further differs according to the type of production (discrete and continuous). For discrete production, the sub-indicators remain the same as in the case of OEE, only the weights of the individual indicators are added:
PEE = (Availability)k1 x (Performance)k2 x (Quality)k3, where ki is the weight of indicator i, 0 < ki ≤ 1, ∑ki = 1
See PEE for more details.
We can use the indicator weights, for example, if we prefer one of the OEE components when evaluating staff. If different groups of personnel have different effects on the results of each indicator (operators on quality, adjusters on performance, foremen on utilisation, etc.), we can use calculations with different weights to evaluate these groups.
OFE – the OFE (Overall Factory Effectiveness) methodology is used to express the efficiency related to the whole production enterprise. If there are multiple production steps on multiple facilities, the classic OEE cannot be used at the whole-factory level. While OEE focuses on the efficiency of individual facilities, OFE evaluates all facilities together. It incorporates the relationships and interactions between different equipment and processes.
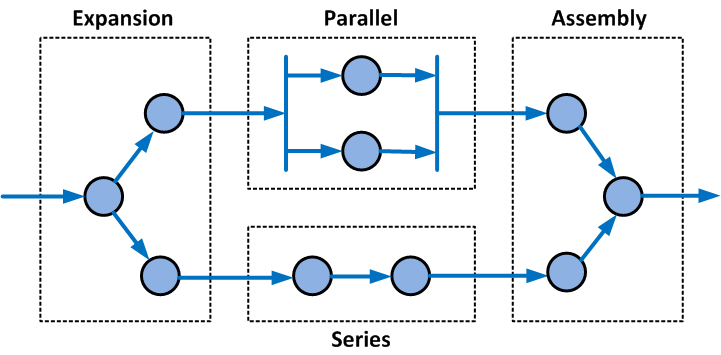
The production environment consists of subsystems that can be divided into 4 basic groups:
- Series (serial, in series)
- Parallel (parallel, simultaneous)
- Assembly (connection, assembly)
- Expansion (division, expansion)
Using these 4 groups of subsystems, the entire production operation can be modelled. The efficiency of the individual subsystems is then examined by methodologies such as OTE (Overall Throughput Effectiveness) or CTE (Cycle Time Effectiveness).
OTE expresses the ratio between the actual output and the theoretically possible output. The methodology is closely related to simulation techniques for increasing production productivity. CTE is then the ratio between the theoretical cycle length and the actual cycle length.
If there are no complex relationships and interactions between different production equipment and processes, we can be satisfied with some elementary aggregation method:
- Arithmetic mean – simple arithmetic mean
- Modus – the most common value, the modus of a discrete or continuous random variable
- Median – middle value
- Minimum – minimum value, bottleneck in the production process
- Maximum – maximum value
- Weighted arithmetic average – for each of the sub-indicators a different variable can be the weight
- Harmonic mean – average production rate, …
- Geometric mean – average growth rate, …
A special case of the elementary aggregation method is the so called pooled facility, which represents a group of production facilities that are treated as one production facility realizing parallel production.
We use aggregation methods to calculate OEE over different objects (specifically over groups of devices), see Chapter 4 – Objects for OEE evaluation.
OEE STAFF EVALUATION
Accurate information on production efficiency, obtained by deploying OEE tools, opens the way for evaluating personnel according to the OEE values achieved.
The use of OEE for staff appraisal and evaluation brings:
- Systematic approach – measurement and evaluation is regular, automated and transparent according to established rules
- measurable criterion – hard KPIs
- Comprehensive assessment – compared, for example, to quality assessment, which is only one of the OEE parameters
- Team approach – the causes of the OEE decline cannot usually be attributed to one person, but to a group of people (operators, adjusters, handlers, foremen, planners, …)
APPLICATION OF OEE IN MANAGEMENT METHODOLOGIES
OEE can be embedded in established methodologies for staff appraisal and management:
MBO – In the MBO (Management by Objectives) method, OEE indicators can be treated as targets. The method, described by Peter F. Drucker (The Practice of Management, 1955), is based on setting and agreeing objectives and evaluating the success of their achievement. OEE fulfils the main aspects of this method:
- Setting targets – setting OEE targets for given workplaces, products, contracts, etc.
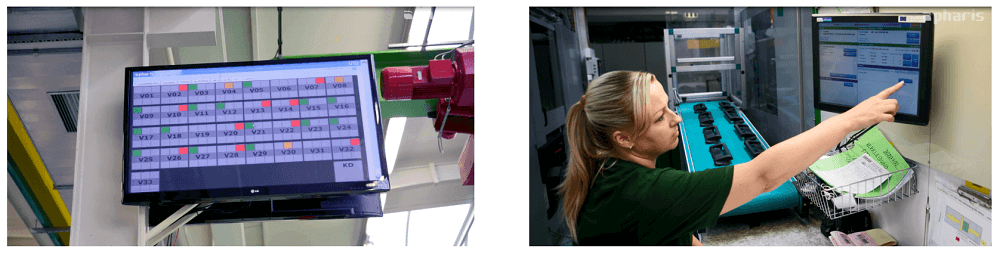
- Familiarization with targets – publication of OEE target values (on operator terminals, visualization panels, intranet, …)
- Target monitoring – automated real-time evaluation and alarming of OEE development
- Familiarisation with the fulfilment of the objectives – publication of the achieved OEE values (on operator terminals, visualisation panels, intranet, …)
- Provision of comparisons – the requested comparisons are made available in real time along with the achieved OEE values
Comparisons are made:
- Towards the set goals
- Between the groups
- For development time
ANALYSIS OF THE CAUSES OF THE DECLINE IN OEE
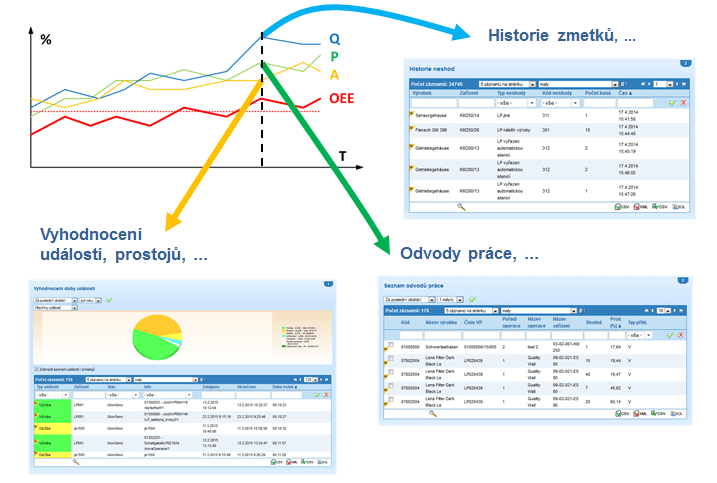
OEE can identify areas of declining efficiency through its sub-indicators. Staff are presented not only with the aggregate results of the OEE, but also with the results of the Availability, Performance and Quality sub-indicators. In addition, staff should be provided with a breakdown of Availability, Performance and Quality into individual primary indicators. The decomposition of the Quality indicator is in practice implemented, for example, by a list of individual occurrences of non-conforming items during the incriminated period. For the Performance indicator, it can be a list of individual work inputs and for the Availability indicator, it can be a list of events and downtime on a given machine.
OBJECTS FOR EVALUATING OEE
While the standard OEE metric evaluates the efficiency of a single piece of production equipment or a group of production equipment, to evaluate personnel it is necessary to relate the calculation to a given person, group of people, shift or production job or product.
Manufacturing companies most often request the breakdown of OEE evaluation through these objects:
- Product / Production Equipment
- Product
- Production order / Production equipment
- Production order
- Person / Production facility
- Person
- Group of persons / Production facilities
- Group of persons
- Shift / Production Equipment
- Shift
Possibly other combinations of these views:
- Shift / Production order / Production equipment
- Shift / Product / Production Equipment
- …
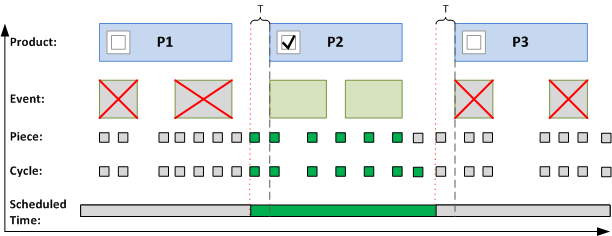
While the standard OEE calculation is straightforward in determining the Availability of the production equipment, the calculations performed over the above objects require the solution of intervals that are not directly linked to the objects. For example:
- To which product does the downtime caused by moving a machine to another production fall?
- To which person does the production taking place at the time of staff changeover belong? To the original operator, the new operator, or both operators? Changeover events may build on each other, overlap or have a gap between them
To solve the above and other similar situations, it is necessary to specify and set the rules that will be applied to the calculation of the intervals (how to include the intervals in the calculation, to which objects to bind the intervals, how long to bind the intervals, etc.).
We must also ensure that the activities taking place at these intervals are properly recorded. For example, distinguishing between the activities falling within the end of one production and those falling within the start of the next production.
If the view goes beyond a single production facility (e.g. the efficiency of production of a given product over a group of selected production facilities), then it is also necessary to resort to one of the aggregation methods, see Chapter 1 – Derived OEE indicators.
SEPARATION OF HUMAN AND MACHINE FACTORS
The described methods of personnel evaluation are based on the overall efficiency of the production facility, which is based on both human and machine factors. In most cases, both factors play a significant role. Even in a fully automated plant, personnel intervene in the production process – for example, as maintenance personnel. The machine factor can then be minimised in purely manual operations. However, a significant part of assembly operations use various production equipment and therefore the machine factor also has an impact on the efficiency of the workplace.
If we want to eliminate the machine factor and focus on the work of the operator, we can use methodologies that can distinguish between these factors.
OLE
The OLE(Overall Labour Effectiveness) metric provides a separate view of the causes of efficiency losses caused by production equipment and production personnel. While the OEE metric does not distinguish whether the efficiency decline is due to production equipment or production personnel, OLE focuses on these differences and in particular on personnel efficiency.
The examples given describe situations where OEE does not distinguish the causes of efficiency losses:
- Due to the current shortage of qualified personnel, the machine cannot be rebuilt. The machine shows downtime and the OEE value decreases. However, the cause of the decrease is not due to the machine potential. This fact can be detected from the efficiency loss analysis, but it is not detected in the overall OEE result.

The machine shows satisfactory OEE values, but a disproportionately high number of service personnel is allocated to its operation. The low efficiency of the staff is not reflected in the OEE result and is not covered by standard efficiency loss analysis tools, as the situation is not reflected as a loss of OEE.

The calculation of OLE is performed according to the same relationship as OEE:
OLE = Availability * Performance * Quality
However, the OLE sub-indicators are influenced by different factors than in the case of OEE:
Availability
- Absences, holidays, sick leave,…
- Training, meetings, …
- Scheduling, downtime, shift changes,…
Performance
- Availability of instructions, tools, materials, …
- Qualifications, skills, …
- Training, mentoring,…
Quality
- Qualifications, skills, knowledge, motivation, …
- Compliance with instructions, proper tool handling, …

CONCLUSION
OEE is a metric designed to monitor the overall efficiency of individual production facilities. Its use for personnel evaluation is a controversial topic. Nevertheless, manufacturing companies use OEE metrics in evaluating and valuing personnel.
This paper describes derived OEE indicators that are either directly intended for personnel evaluation or exhibit characteristics that can be used in personnel evaluation. The article also mentioned the benefits of using OEE and the possibility of incorporating OEE into established personnel management metrics.
Miroslav Patočka
MES PHARIS Analyst