Overall Equipment Effectiveness (OEE) is a quantitative indicator of the efficiency of production equipment. It provides a quantifiable comparison of the efficiency of individual production facilities and entire manufacturing companies. It incorporates multiple components affecting overall efficiency that can be independently evaluated and used to eliminate identified losses (organization, performance and quality).
EFFICIENCY OR EFFECTIVENESS?
Let’s first look at the concepts of “efficiency” and “effectiveness”. These terms are often used interchangeably and even within the same text, authors often use them synonymously. However, their meaning is not the same. Efficiency is efficiency (generally the ratio between the benefits of an activity and its costs), while effectiveness is effectiveness, meaningfulness (the relationship between the stated goal and the consequence).
The traditional concept of TPM defines OEE as Overall Equipment Eficiency, i.e. overall equipment effectiveness. The newer concept, however, sees OEE as Overall Equipment Effectiveness, i.e. the overall efficiency of the equipment. In the following, we will refer to OEE as Overall Equipment Effectiveness.
OVERALL PLANT EFFICIENCY
The Overall Equipment Effectiveness (OEE) indicator was created in the 1960s by Seiichi Nakajima of Nippon Denso. In the late 1980s, this methodology became known thanks to the spread of TPM. In the mid-1990s, it is then applied in the semiconductor manufacturing sector to increase the productivity of production facilities. Gradually, the methodology was adopted by other industrial sectors.
The basic idea of the methodology lies in the relationship:
OEE = Useful Equipment Time / Available Equipment Time,
Where:
- Device uptime – the time the device produces identical products
- Available time of the device – the time when the device should produce
The difference between useful time and available time is determined by the level of utilisation, performance and quality. The most common expression of the relationship for calculating OEE uses these three indicators:
OEE = Availability x Performance x Quality,
Where
- Availability – the ratio between production time and available time
- Performance – ratio between net production time and production time
- Quality – the ratio between useful production time and net production time
The following definitions and relationships are used for the practical calculation of these indicators:
Availability
Ratio between production time and available time. Production time means the time when the equipment is running. Available time means the expected running time of the equipment. For the calculation, a formula of the following form is used:
Availability = Operating Time / Loading Time,
Where
- Operating Time – the actual running time of the device
- Loading Time – the expected running time of the device
Performance
Ratio between actual output and planned output. The formula used for the calculation is as follows:
Performance = Total Output / Potential Output,
Performance = (Total Output * Ideal Cycle Time) / Operating Time,
Where
- Total Output – total number of pieces produced
- Potential Output – planned number of units produced
- Ideal Cycle Time – planned cycle time (production of one piece)
- Operating Time – the actual running time of the device
Quality
The ratio between the output of quality products and the output of all products. A formula of the following form is used for the calculation:
Quality = Good Output / Total Output,
Where
- Good Output – number of quality pieces produced
- Total Output – total number of pieces produced
OEE CALCULATION EXAMPLE
Let’s look at an example of a specific OEE calculation:
- The device running in three-shift operation has a defined available time: 22 h and 50 min.
- The device was actually running: 16 h 4 min and 29 s
- During this time the facility produced: 2000 units
- Of these, there were: 1970 pieces
- The prescribed cycle time is: 28.3 s
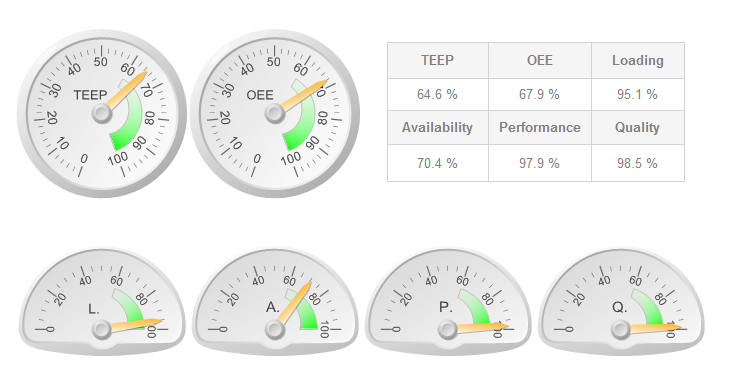
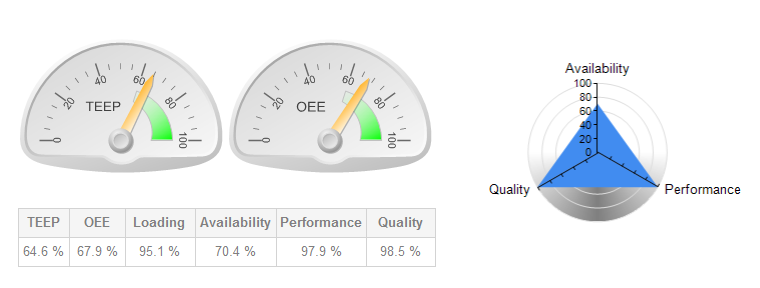
Availability = Operating Time / Loading Time
Availability = 16.075 hours / 22.83 hours = 0.704 = 70.4%
Performance = (Total Output * Ideal Cycle Time) / Operating Time
Performance = (2000 * 28.3 s) / 16.075 h = 0.979 = 97.9%
Quality = Good Output / Total Output
Quality = 1970 pcs / 2000 pcs = 0,985 = 98,5 %
OEE = Availability x Performance x Quality
OEE = 0,704 * 0,979 * 0,985 = 0,679 = 67,9 %
It is reported that top companies achieve OEE of 85% after successful implementation of TPM. However, most manufacturing companies achieve OEE at around 60%. However, it is important to consider how and on what data this figure was calculated. The quality and method of data collection play an important role. For more information see the chapter on OEE tools.
LOSSES OF OEE
OEE is a key TPM (Total Productive Maintenance) tool used to reduce and eliminate the “Six Big Losses” that limit production.
The six major losses are divided into three basic areas:
Losses from downtime
- Equipment malfunctions
- Adjusting and setting
Power losses
- Idle time and short breaks
- Speed reduction
Losses in quality
- Discrepancies and repairs
- Start-up losses
If we include the derived TEEP indicator in the loss analysis, we obtain the losses given by the production organisation. These losses are caused by downtimes for which production is not planned (single or double shift production, holidays, vacations, …).
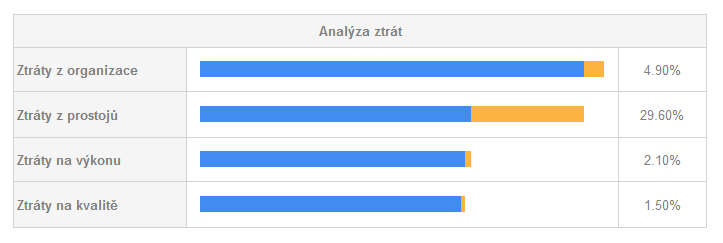
By analysing the loss areas we should be able to identify the causes and sources of losses. This will allow us to find ways to increase the efficiency of the use of machinery and equipment.
OEE INSTRUMENTS
An important aspect for the calculation of OEE indicators is the collection of input data. Data collection strategies can range from primitive manual records to sophisticated automated solutions.
Manual data collection is based on paper forms on which production operators record events affecting production efficiency. These are reports back from production (pieces produced, non-conforming pieces, …), causes and duration of downtime, reasons for lost output, etc. Sophisticated solutions are then based on the automatic collection of this data from the machines, the continuous registration of the operator for the activities performed, the continuous reporting of non-conforming production and deviating production.
The difference between manual and automated data collection is mainly in the following areas:
- Data quality – data obtained manually contain intentional and unintentional errors and inaccuracies (given by the initial entry by the production operator or copying into a superior system), do not take into account short-term downtimes and their acquisition burdens production operators and other administrative staff.
- Data Availability – Data collected manually is not available in real time. They are mostly taken at the end of the shift and are received by the parent systems with further delays due to manual input.
Automatic data collection (from machines or electronic operator registration) eliminates errors and inaccuracies and provides real-time data. Thus, OEE assessments can be made for both completed and ongoing production.
Automated OEE systems usually include tools for visualisation, analysis and reporting of OEE results. Such tools should include features for creating customizable reports, aggregation functions, loss analysis tools, aggregate and detailed reports across individual machines to entire manufacturing plants.
To relate the OEE indicators to the enterprise level, the derived OAE, OPE and OFE indicators come into play, which we will look at in the next section.
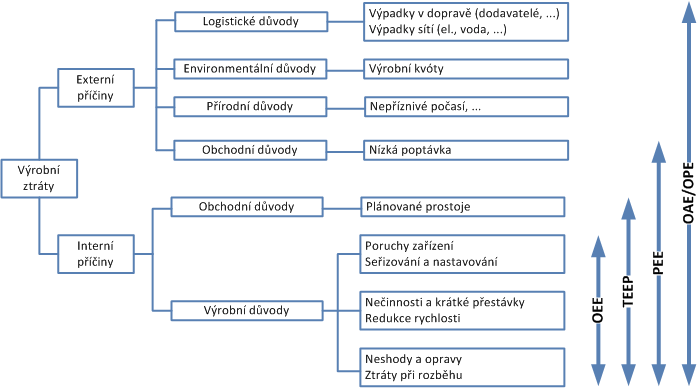
DERIVED INDICATORS TEEP, PEE, OAE, OPE, OFE, OTE, CTE
In addition to the OEE, other derived indicators have been developed in response to the new requirements of the efficiency assessment. Some of them (TEEP, PEE, …) are at the facility level, while others (OAE, OPE, OFE, …) extend OEE to the enterprise level. Let’s go through their basic characteristics:
TEEP – TOTAL EQUIPMENT EFFECTIVENESS PERFORMANCE
The most well-known of the derived indicators, TEEP (Total Equipment Effectiveness Performance), takes planned downtime into account in the calculation. While OEE quantifies how efficiently the equipment is used within the scheduled time (scheduled shifts), TEEP assesses the efficiency of the equipment in relation to calendar time (i.e. 24 hours per day, 7 days per week and 365 days per year). If the operation of the plant were scheduled for 24 hours per day, 7 days per week and 365 days per year, then TEEP corresponds to OEE. TEEP can be expressed by the relation:
TEEP = Time in Use / Calendar Time,
or:
TEEP= Loading x Availability x Performance x Quality = Loading x OEE,
where
- Loading (availability) – ratio between available time and calendar time
- Availability – ratio between production time and available time
- Performance – ratio between net production time and production time
- Quality – the ratio between useful production time and net production time
If we look at the above example of OEE calculation and supplement it with the TEEP calculation, we get the following results:
Loading = 22 hrs 50 min / 24 hrs = 0.951 = 95.1%
TEEP = 0.951 * 0.704 * 0.979 * 0.985 = 0.679 = 0.646 = 64.6%
PEE – PRODUCTION EQUIPMENT EFFICIENCY
Another derived indicator is PEE (Production Equipment Efficiency). The main difference of this indicator lies in the weights of the sub-indicators (Availability, Performance and Quality). While in OEE all sub-indicators have the same importance, in PEE the importance of a sub-indicator is determined by a set weight.
The method of calculating the PEE also varies according to the type of production:
Discreet production
For discrete manufacturing, the sub-indicators remain the same as for OEE, but the weights of the individual indicators are added:
PEE= (Availability)k1 x (Performance)k2 x (Quality)k3,
where
- ki – weight of indicator i, 0 < ki ≤ 1, ∑ki = 1
Continuous production
For continuous production, the relationship for calculating PEE is defined as:
PEE = (Availability)k1 x (Attainment)k2 x (Performance)k3 x (Quality)k4 x (PSE)k5 x (OU)k6,
Where
- ki – weight of indicator i, 0 < ki ≤ 1, ∑ki = 1
- Availability – takes into account planned downtime and corresponds approximately to the Loading indicator from the TEEP methodology
- Performance – corresponds to the Performance indicator from the TEEP methodology
- Quality – corresponds to the Quality indicator from the TEEP methodology
- PSE – Product Support Efficiency takes into account transaction losses
- OU – Operating Utility takes into account demand losses
In the case of continuous production, it is assumed that there are no set-up losses and therefore they are not taken into account in the PEE calculation.
OAE/OPE – OVERALL ASSET/PRODUCTION EFFECTIVENESS
The OAE (Overall Asset Effectiveness) and OPE (Overall Production Effectiveness) indicators are based on the OEE methodology. They have been designed to meet the specific requirements of different sectors and therefore have different definitions in practice. Of all the indicators mentioned, they cover the largest range of calculated losses – they are used to identify and measure all losses associated with the entire production process.
As far as the application of the indicators in industry is concerned, they both have the same meaning, but differ in the concept of production losses. OAE quantifies production losses by output, whereas OPE quantifies them by time.
OFE – OVERALL FACTORY EFFECTIVENESS
The OFE (Overall Factory Effectiveness) methodology is used to express efficiency in relation to the entire production enterprise. If there are multiple production steps in a production process on multiple facilities, the classical OEE cannot be used at the whole-factory level. While OEE focuses on the efficiency of individual plants, OFE evaluates all plants together. It incorporates the relationships and interactions between different equipment and processes.
The production environment consists of subsystems that can be divided into 4 basic groups:
- Series (serial, in series)
- Parallel (parallel, simultaneous)
- Assembly (connection, assembly)
- Expansion (division, expansion)
Using these 4 groups of subsystems, the entire production operation can be modelled. The efficiency of the individual subsystems is then examined by methodologies such as OTE(Overall Throughput Effectiveness) or CTE(Cycle Time Effectiveness).
OTE expresses the ratio between the actual output and the theoretically possible output. The methodology is closely related to simulation techniques for increasing production productivity. CTE is then the ratio between the theoretical cycle length and the actual cycle length.
Miroslav Patočka
MES PHARIS Analyst
UNIS, a.s.